Problem was that I didn’t get a live picture from the camera. Solution: Use the HDMI 1 not 2 port.
Category Archives: Raspberry Pi
Raspberry pi & waveshare 2.7 e-ink Display & python
Start with a headless raspberry, no need to connect monitor, keyboard: https://raspberrypi.stackexchange.com/questions/10251/prepare-sd-card-for-wifi-on-headless-pi
Find the raspberry in your router and connect with ssh. Useullay steps are:
sudo raspi-config
sudo reboot
(neu einloggen)
sudo apt-get update -y
sudo apt-get upgrade -y
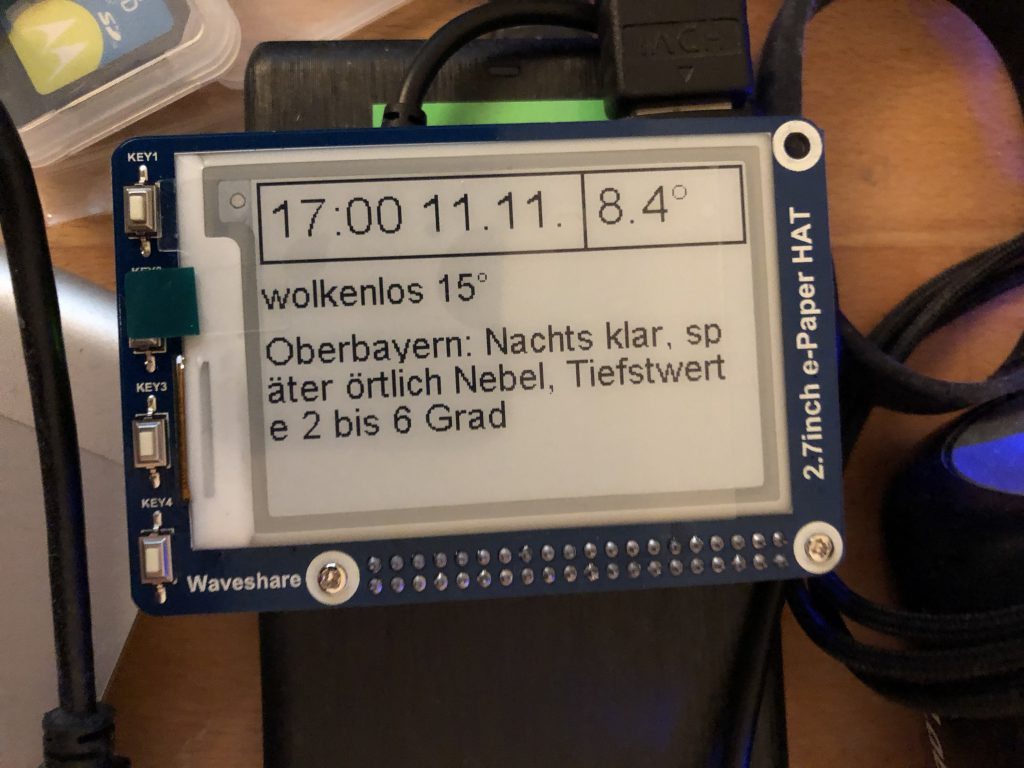
Here’s some example python code for drawing text horizontal on the waveshare e-ink display. You’ll find also a example where to find the length of text where to break lines. This examples reads some small text from a web site and looks up a rss feed for the weather.
Install the fonts https://www.raspberrypi.org/forums/viewtopic.php?t=133772
sudo apt-get install ttf-mscorefonts-installer
Install libraries https://www.waveshare.com/wiki/Pioneer600#Libraries_Installation_for_RPi
sudo apt-get install git-core
git clone git://git.drogon.net/wiringPi
cd wiringPi
 ./build
https://www.waveshare.com/wiki/3.7inch_e-Paper_HAT


sudo apt-get install wiringpi
wget https://project-downloads.drogon.net/wiringpi-latest.deb
sudo dpkg -i wiringpi-latest.deb
gpio -v
cd
wget http://www.airspayce.com/mikem/bcm2835/bcm2835-1.59.tar.gz
tar zxvf bcm2835-1.59.tar.gz
cd bcm2835-1.59
./configure
make
sudo make check
sudo make install
- Install Python2 libraries
sudo apt-get update
sudo apt-get install python-pip
sudo apt-get install python-pil
sudo apt-get install python-numpy
sudo pip install RPi.GPIO
sudo pip install spidev
- Install Python3 libraries
sudo apt-get update
sudo apt-get install python3-pip
sudo apt-get install python3-pil
sudo apt-get install python3-numpy
sudo pip3 install RPi.GPIO
sudo pip3 install spidev

pip install feedparser
(Before running the API codes we provided, you should start up the corresponding core drivers of the interfaces. In the ready-to-use system image file, both I2C and SPI are set to Enable by default, but the serial port is still in the terminal debugging function mode.)
- Enable the I2C function. Run the following command to configure your Raspberry Pi board:
sudo raspi-config
Select
AdvancedInterface Options -> I2C -> yes, to start up the I2C core driver. Then you also need to modify the configuration file. Run the following command to open the configuration file:sudo nano /etc/modules
Add the following two lines to the configuration file
-
- i2c-bcm2708
- i2c-dev
- Press the keys Ctrl+X to exit, and input Y to save the settings. Then, reboot the module to make the settings take effect.
-
- Enable the serial function. The serial port of RPi is set to serial terminal debugging function mode by default. If you want the serial port services as a common IO, you should modify the settings on the RPi. When the terminal debugging function is disabled, you cannot access RPi board via the serial port any more. If you want to control the RPi, you may need to enable the debugging function of the serial port again.
sudo raspi-config
Select
AdvancedInterface Options -> Serial. Select the option no can disable the serial debugging function. And then, the serial port can be used for serial communication. And select the option yes can enable the serial debugging function. You should reboot the module to make the settings take effect.
- Note: the serial port on Raspberry Pi 3 Model B is unusable, because Pin 14 and Pin 15 is connected to the on-board Bluetooth model.
- Start up the spi function, run the following command:
sudo raspi-config
Select
AdvancedInterface Options -> I2C -> yes, to start up I2C core driver.
Code
# coding: utf8
##
 #  width 176
 #  height 264
 ##


import epd2in7
from PIL import Image
from PIL import ImageFont
from PIL import ImageDraw
import time
import urllib2
import feedparser
import datetime

def getLengthText(myTextInput, myFont, pixels):
    #font = ImageFont.truetype('/usr/share/fonts/truetype/freefont/msttcorefonts/comic.ttf', 28)
    #font = ImageFont.truetype("arial", 20)
    myText = myTextInput
    mlen = 0
    mlen = len(myText)
    w, h = myFont.getsize(myText)
    while pixels < w:
        myText = myText[0:mlen-2]
        mlen = len(myText)
        w, h = myFont.getsize(myText)
    return mlen

def addText(myImage,myText, myFont, xx,yy):
    #font = ImageFont.truetype('/usr/share/fonts/truetype/freefont/msttcorefonts/comic.ttf', 28)
    #font = ImageFont.truetype("arial", 20)
    w, h = myFont.getsize(myText)
    mask = Image.new('1', (w, h), 255)
    draw2 = ImageDraw.Draw(mask)
    draw2.text((0, 0), myText, font = myFont, fill = 0)
    mask = mask.rotate(90, expand=True)
    myImage.paste(mask, (xx,epd2in7.EPD_HEIGHT - w - yy ))

def main():
    epd = epd2in7.EPD()
    epd.init()

    image = Image.new('1', (epd2in7.EPD_WIDTH, epd2in7.EPD_HEIGHT), 255)    # 255: clear the image with white
    draw = ImageDraw.Draw(image)

    font = ImageFont.truetype("arial", 18)
    font2 = ImageFont.truetype("comic", 24)
    font3 = ImageFont.truetype("arial", 28)

    # get text from a feed
    #d = feedparser.parse('http://www.reddit.com/r/news/.rss')
    d = feedparser.parse('https://www.br.de/wetter/action/feeds/bayernwetter.do')
    dnr = 0
    dlen = len(d['entries'])
    #test
    oberbayern = 0
    for n in range(dlen):
        actentry = d['entries'][n]['title'].encode('utf-8').strip()
        print str(n) + " " + actentry[0:8]
        if actentry[0:8] == "Oberbaye":
            oberbayern = n
        #münchen
        if actentry[0:8] == "München":
            muenchen = n


    print d['entries'][oberbayern]['title'].encode('utf-8').strip()
    print d['entries'][muenchen]['title'].encode('utf-8').strip()
    nb = d['entries'][oberbayern]['title'].strip()

    # get text from a website
    ttext = "err"
    try:
            #response = urllib2.urlopen('http://4johannes.de/weather/lowest.txt')
            response = urllib2.urlopen('http://eiseler.com/perltest/tempmysqlcoldestblank.pl')
            ttext = response.read().strip()
            print(ttext)
    except:
            print("fehler2")
            ttext = "err2"

    # add to display

    # first Line
    grad = u'°'
    #entlang umgerechnet oben 1,1 nach 1,264/2
    draw.line((0, 264, 0, 0), fill = 0)
    draw.line((1, 264, 1, 0), fill = 0)
    addText(image, datetime.datetime.now().strftime("%H:%M %d.%m."), font3, 5, 6)
    addText(image, ttext + grad, font3, 5, 182)
    # horizontal unter der schrift:
    draw.line((38, 264, 38, 0), fill = 0)
    draw.line((39, 264, 39, 0), fill = 0)
    # senkrechte Linien, wenn quer gesehen
    draw.line((0, 264-180+5, 39, 264-180+5), fill = 0)
    draw.line((0, 264-180+4, 39, 264-180+4), fill = 0)
    draw.line((0, 263, 39, 263), fill = 0)
    draw.line((0, 262, 39, 262), fill = 0)

    draw.line((0, 0, 39, 0), fill = 0)
    draw.line((0, 1, 39, 1), fill = 0)


    muc = "München"
    mstr = d['entries'][muenchen]['title'].strip()
    mstr2 = mstr[mstr.find("):")+3:]

    xlen = 0
    xlen = getLengthText(mstr2,font, 264)
    mstr3 = mstr2[0:xlen]
    msRest = mstr2[xlen:]
    xlen = getLengthText(msRest,font, 264)
    mstr4 = msRest[0:xlen]

    addText(image, mstr3, font, 40, 0)
    addText(image, mstr4, font, 60, 0)
    #addText(image, "012345678901234567890123456789", font, 60, 0)

    print(nb.encode('utf-8'))
    xlen = 0
    xlen = getLengthText(nb,font, 264)
    nb1 = nb[0:xlen]
    nbRest = nb[xlen:]
    xlen = getLengthText(nbRest,font, 264)
    nb2 = nbRest[0:xlen]
    nbRest = nbRest[xlen:]
    xlen = getLengthText(nbRest,font, 264)
    nb3 = nbRest[0:xlen]
    nbRest = nbRest[xlen:]
    xlen = getLengthText(nbRest,font, 264)
    nb4 = nbRest[0:xlen]
    nbRest = nbRest[xlen:]
    xlen = getLengthText(nbRest,font, 264)
    nb5 = nbRest[0:xlen]

    print(nb1.encode('utf-8'))
    print(nb2.encode('utf-8'))
    print(nb3.encode('utf-8'))
    print(nb4.encode('utf-8'))
    print(nb5.encode('utf-8'))
    addText(image, nb1, font, 80, 0)
    addText(image, nb2, font, 100, 0)
    addText(image, nb3, font, 120, 0)
    addText(image, nb4, font, 140, 0)
    addText(image, nb5, font, 160, 0)
    #addText(image, "abcdef", font, 140, 0)
    #addText(image, "abcdef", font, 160, 0)


    epd.display_frame(epd.get_frame_buffer(image))
    # display images
    #epd.display_frame(epd.get_frame_buffer(Image.open('demopill2.bmp')))

if __name__ == '__main__':
    main()
Günstig Temperatur, Luftfeuchte und Energie messen mit Raspberry Pi oder PC
Drahtloses Anbinden von Temperatursensoren und Energiemesser. Und das noch günstig. Sehr hilfreich war dieser Beitrag. Er beschreibt die Anbindung von drahtlosen Sensoren an Fhem. Fhem wollte ich jetzt (noch) nicht aufsetzen, deshalb realisierte ich meine eigene Anbindung in der die Temperaturkurven auf dem Webserver des Raspi angezeigt werden.
Zutaten: Ein Raspi (kann aber auch ein NAS, PC oder Mac sein). Ein Jeelink (arduino mit 868 MHz Sender/Empfänger auf einem USB-Stick) (Versand dauert ca. 4 Tage). Einen (oder mehrere, ich habe inzwischen 7) passende Temperatursensoren. (Gibt es auch mit Luftfeuchtemesser).
Verarbeitung: Der Jeelink muss mit dem passenden Sketch bestückt werden. Danach lauscht er nach senden Thermostationen und gibt das Ergebnis über seine serielle Schnittstelle aus. Zum Auslesen habe ich mir folgendes Perl-Script erstellt (alpha):
#!/usr/bin/perl
$|++;

# LaCrosse auslesen
# Interpretation:
# OK
# 9
# 1 Byte: addr
# 1 Byte: battery, type, channel
# 2 Byte: temperature
# 1 Byte: battery_low, humidity

use strict;
use warnings;

use Device::SerialPort;

my $device1 = 'F0';
my $device2 = '68';
my $device3 = 'E0';
my $device4 = 'CC';
my $device5 = '58';
my $device6 = 'D4'; # Fensterbrett war 38
my $device7 = '54';
my $device8 = 'DC';
my $device9 = '94';

my $port;
my %devices = ($device1 => 'n', $device2 => 'n', $device3 => 'n', $device4 => 'n', $device5 => 'n', $device6 => 'n', $device7 => 'n', $device8 => 'n', $device9 => 'n');
	my $sec;
	my $min;
	my $hour;
	my $mday;
	my $mon;
	my $year;
	my $wday;
	my $yday;
	my $isdst;
	my @myvalues;
	my $hygro;

 sub check_output{

     my $answer;
     my $answer1;
     # my( @bytes, $channel,$cmd,$addr,$data,$power,$consumption );
     my( @bytes, $addr, $battery_new, $type, $channel, $temperature, $battery_low, $humidity );
      my $state;
      my $readonly;

	my @array;
	my $len;

 while(1){
	print STDERR "wait for read\n";
    $answer1 = $port->read(255);
   	print STDERR "\n>" . $answer1 . "<-\n";

	#print "read\n";
    if ($answer1 ne "") {
    	$answer = $answer . $answer1;
    	#print "\n>" . $answer . "<\n";
		if( $answer =~ m/^OK.*\n/ ) {
			last;
		}
		$len = length($answer);
		if ($answer ne "" && $len > 1000){ #something went wrong
			print STDERR "---- delete length $len too long----\n";
			print STDERR ">" . $answer . "<\n";
			$answer = "";
			}
		if (length($answer) >= 2){
			if (substr($answer, 0, 2) ne "OK"){ #something went wrong
				print  STDERR  "---- delete wrong start----\n";
				$answer = "";
				}
			}

    }
    sleep(2);
}
#Falls mehrere Zeilen geliefert werden,
@array=split(/\n/, $answer);

foreach (@array){
$answer = $_;
#  if( $answer =~ m/^OK.*\n/ ) {
  if( $answer =~ m/OK 9 \d+ \d+ \d+ \d+ \d+/ ) {
    @bytes = split( ' ', substr($answer, 5) );

 $addr = sprintf( "%02X", $bytes[0] );
$battery_new = ($bytes[1] & 0x80) >> 7;
$type = ($bytes[1] & 0x70) >> 4;
$channel = $bytes[1] & 0x0F;
$temperature = ($bytes[2]*256 + $bytes[3] - 1000)/10;
$battery_low = ($bytes[4] & 0x80) >> 7;
$humidity = $bytes[4] & 0x7f;

 # we simply write the temperatur at the hash
	print STDERR "Adr: " . $addr;
    print STDERR " Batt_new: " . $battery_new;
    print STDERR " Type: " . $type;
    print STDERR " Chan: " . $channel;
    print STDERR " Temp: " . $temperature;
    print STDERR " Batt_low: " . $battery_low;
    print STDERR " Hum: " . $humidity . "\n";
  $devices{$addr} = $temperature;
  if ($addr eq 'E0'){
  	$hygro = $humidity;
  }

  #Wenn neue Adresse, dann hier ausgeben

    $answer ="";

}

 }#for each
}  # sub check_output

# -------------
# Hauptprogramm

    # Set up the serial port
    #print "Start\n";

    $port = Device::SerialPort->new("/dev/ttyUSB0");
#    $port = Device::SerialPort->new("/dev/tty.usbserial-AM01YRW0");

    # 19200, 81N on the USB ftdi driver
    $port->baudrate(57600); # you may change this value
    $port->databits(8); # but not this and the two following
    $port->parity("none");
    $port->stopbits(1);
    $port-> write_settings;
    $port-> lookclear;
     #print "start";

my $i;
$i = 7;
while($i > 0){

print STDERR "Durchlauf Nr: $i \n";

$port-> lookclear;
sleep(4);
check_output();

$i = $i -1;

#sleep(900);
#exit;

#debug

 # output block; put at the end
    ($sec,$min,$hour,$mday,$mon,$year,$wday,$yday,$isdst) = localtime();
    $mon = $mon +1;
    $mon = sprintf("%02d", $mon);
    $mday = sprintf("%02d", $mday);
    $hour = sprintf("%02d", $hour);
    $min = sprintf("%02d", $min);
    $sec = sprintf("%02d", $sec);
    $year = $year + 1900;
	#@myvalues = values %devices;

# ToDo Aufräumen, muss auch weiterlaufen wenn bei einem Gerät die Batterie leer ist
if  ($devices{$device1} eq "n") {
 print STDERR "na 1  $device1 nicht gefunden\n";
 sleep(4);
 next;
}
if  ($devices{$device2} eq "n") {
 print STDERR "na 2  $device2 nicht gefunden\n";
 sleep(4);
 next;
}
if  ($devices{$device3} eq "n") {
 print STDERR "na 3  $device3 nicht gefunden\n";
 sleep(4);
 next;
}
if  ($devices{$device4} eq "n") {
 print STDERR "na 4  $device4 nicht gefunden\n";
 sleep(4);
 next;
}
if  ($devices{$device5} eq "n") {
 print STDERR "na 5  $device5 nicht gefunden\n";
 sleep(4);
 next;
}
if  ($devices{$device6} eq "n") {
 print STDERR "na 6  $device6 nicht gefunden\n";
 sleep(4);
 next;
}
if  ($devices{$device7} eq "n") {
 print STDERR "na 7 $device7 nicht gefunden\n";
 sleep(4);
 next;
}
if  ($devices{$device7} eq "n") {
 print STDERR "na 8 $device8 nicht gefunden\n";
 sleep(4);
 next;
}
if  ($devices{$device9} eq "n") {
 print STDERR "na 9 $device9 nicht gefunden\n";
 sleep(4);
 next;
}
	print "$year-$mon-$mday" . "_" . "$hour:$min:$sec";
	print " $devices{$device1}";
	print " $devices{$device2}";
	print " $devices{$device3}";
	print " $hygro";
	print " $devices{$device4}";
	print " $devices{$device5}";
	print " $devices{$device6}";
	print " $devices{$device7}";
	print " $devices{$device8}";
	print " $devices{$device9}";
	print "\n";
 # output block; put at the end

 #nochmal alle aufzaehlen
 print STDERR "Alle erfolgreich gefunden\n";

exit;

$i = $i -1;
sleep(58);
     #print "slept";

 }
    print STDERR "Abbruch nicht genug gefunden\n";
 	print "$year-$mon-$mday" . "_" . "$hour:$min:$sec";
	print " $devices{$device1}";
	print " $devices{$device2}";
	print " $devices{$device3}";
	print " $hygro";
	print " $devices{$device4}";
	print " $devices{$device5}";
	print " $devices{$device6}";
	print " $devices{$device7}";
	print " $devices{$device8}";
	print " $devices{$device9}";
	print "\n";
Dazu noch einen cronjob, der die ausgabe des Perl-scripts parst durch gnuplot schickt und die entstandene Grafikdatei auf den Webserver schiebt. – Fertig.
Detaillierend zu Sebastians Frage:
Die Ausgabedatei sieht z.B. ungefähr so aus (Pro Zeile Datum, Uhrzeit, dann die Werte mit blank getrennt n wenn kein Wert).:
2020-08-18_02:21:17 33.7 n 24.8 61 n -19 n 11.5 21.7 25.4 22 80 23.5 76 25.5 64 25.4 63 17.4 n 26.5 25.2 25.5 26 26 23.1 71 24.2 66 24.4 61
2020-08-18_02:31:18 33.7 n 24.8 61 n -18.9 n 11.4 21.6 25.4 22 79 23.5 76 25.5 64 n n 17.4 n 26.5 25.2 25.5 26 25.9 23.1 71 24.1 66 24.4 61
2020-08-18_02:41:14 33.7 n 24.8 61 n -19 n 11.4 21.6 25.4 22 79 23.5 76 25.5 64 25.4 63 17.2 n 26.4 25.2 25.5 26 25.9 23.1 71 24.1 66 24.4 61
2020-08-18_02:51:18 33.7 n 24.8 61 n -18.9 n 11.4 21.6 25.4 22 79 23.5 76 25.5 64 25.4 63 17.2 n 26.4 25.2 25.4 26 25.9 23 71 24.1 66 24.3 60
Darauf kann mann dann den gnuplot loslassen mit dem Befehl “gnuplot datei”. Die Datei steuert den gnuplot und kann z.B. so aussehen:
set key left #legende nach links
set xtics rotate
set xdata time
set timefmt "%Y-%m-%d_%H:%M:%S"
set format x "%d. %Hh"
set grid
set title "Johannes Temp Small Monitor"
set ylabel "C"
set xlabel "\n1 hour interval"
set terminal gif small size 800, 440 transparent
set output "/home/pi/bin/tc2small.gif"

plot "/home/pi/bin/temperatureout.txt" using 1:6 title "Sensor 1" with lines,\
"/home/pi/bin/temperatureout.txt" using 1:8 title "Sensor2" with lines, \
"/home/pi/bin/w4.txt" using 1:2 title "OpenWeather" with lines, \
"/home/pi/bin/weatherout_wunder3.txt" using 1:2 title "Wunderground" with lines
die entstandene gif Datei schiebe ich dann mittels ftp auf den Webserver.
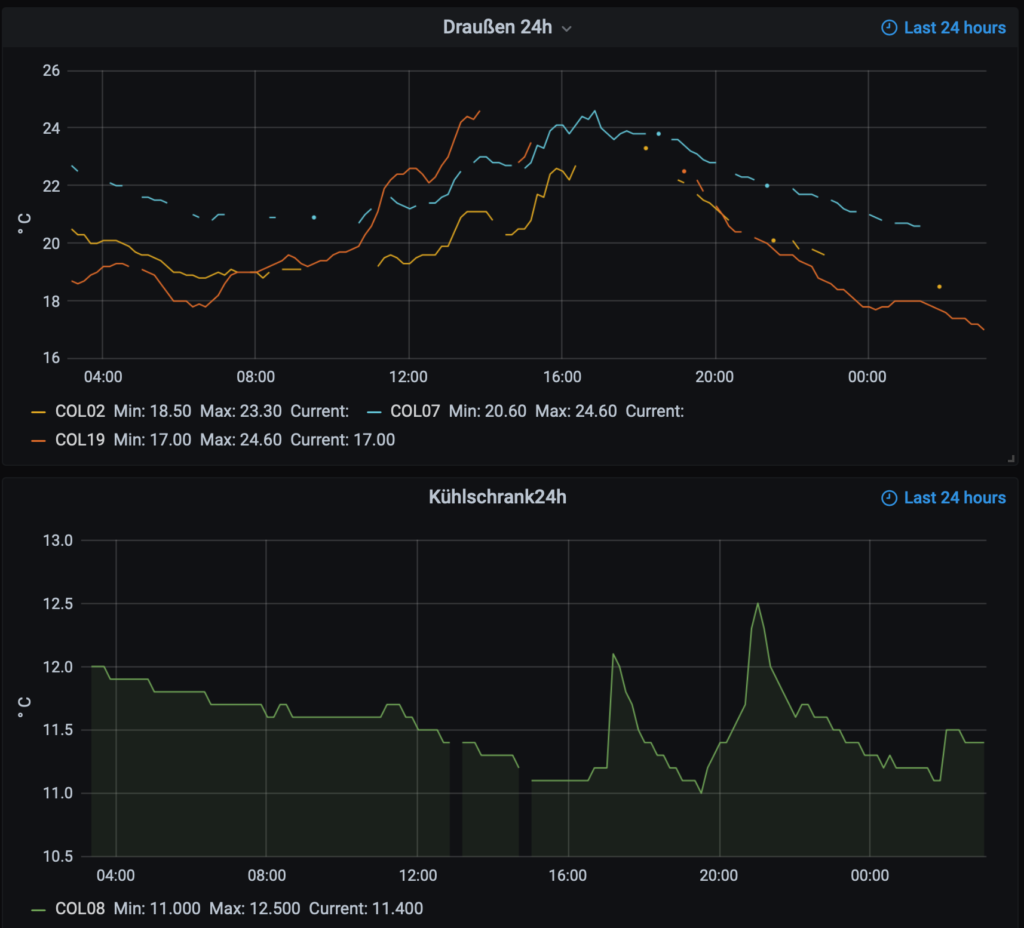
Mittlerweile schreibe ich parallel dazu die Daten in eine mysql Datenbank und erstelle mittels Grafana die Auswertung. Das schaut dann ca. so aus wie unten.
Wie verbindet man den Jeelink mit dem Raspberry PI: link

X-MAS Special – Was ein Geek alles braucht
X-MAS Special – Was ein Geek alles braucht
Weihnachten steht vor der Tür, deshalb heute ein Special was ein geek unbedingt braucht:
PC, Smartphone und Pad: Laufen als Grundausstattung, deshalb keine Deatillierung hier.
NAS (Network Attached Server): Mit minimalen Stromverbrauch und einfacher Bedienung kann das mittlerweile (fast) jeder bedienen. Geliefert wird meist ein leeres Gehäuse, Festplatte(n) einbauen, ans Netz hängen, installieren und los geht’s. Was kann so ein NAS? Netzwerklaufwerke bereitstellen und Datensicherung ist der Grundumfang. Da ein Linux draufläuft und eine einfache Bedienoberfläche (über Browser) vorhanden ist hat man in Windeseile zusätzlich z.B. eine Homepage, ein Blog, ein Fotoverzeichnis, VPN oder einen WordPressblog eingerichtet. Bei Synology (welches ich habe) gibt es zusätzlich noch die Cloud Station, eine private DropBox. Die Hersteller unterscheiden sich vor allem durch die mitgelieferte Software -> wichtiger als Hardware Specs!
Raspberry PI: Scheckkartengroßer Mini PC. Das Betriebssystem, ein angepasstes Linux, liegt auf einer SD Karte. Vorteil: Durch Wechsel der SD-Karte hat man unterschiedliche Konfigurationen zur Hand. Die 2 gebräuchlichsten XMBC und Raspbian. Mit XMBC hat man ein Mediencenter zum Anschluss an den Heim TV. Raspbian ein (abgespecktes) Linux mit Fensteroberfläche, zum wilden UNIX testen, besser aber das ganze Remote zu steuern. Bei mir tut einer seinen Dienst als Flur Monitor mit Wetter und News Anzeige. Ein weiteres Projekt wäre der Selbstbau eines Internetradios.
Apple TV: Wer einfach Video on demand haben möchte, gönne sich ein Apple TV. Vieles geht auch mit dem Raspberry PI, aber einfacher und bequemer ist das Apple Teil. Wenn man sowies schon Produkte dieser Firma daheim hat, sowieso schon fast ein muss. Funktioniert einfach.
Arduino: Ein Microcontroller zum einfachen Basteln. Über USB angeschlossen ermöglicht er einfache Programmierung mittels c. Nach dem Herantasten mit ein paar Leuchtdioden kann man schnell größere Projekte realisieren. Wer keine Lust auf Löten hat, besorge sich ein Steckverbinder Set, z.B. Grove von Seedstudio.
Ferngelenkte Modelle: Die Zeiten des Selberbastelns vom Fernlenkmodellen geht vorbei. Populär sind RTR (ready to run) oder RTF (ready to fly) Modelle. Ich rate von den billig Produkten ab, da ist es Glücksache wenn man etwas gutes erwischt. Für Fahrzeuge ist z.B. Traxxas ein empfehlenswerter Hersteller bei Hubschraubern und Quadcopter empfehle ich Blade.
Unten stehen sind die tags verlinkt, wer mehr zu einem Thema wissen möchte. have fun.
Raspberry Pi mit Internetradio und Airplay
Hier der einige Tipps zum Aufbau eines Raspberry Pis ohns Monitor, Tastatur und Maus mit den Fähigkeiten remote eine Oberfläche bereit zu stellen, Internetradio wieder zu geben und als Airplay Station zu dienen. Achso und nebneher noch einen Webserver (LAMP) laufen lassen.
Was braucht man? Raspberry Pi, Stromversorgung dazu, WLAN-Stick, USB-Soundkarte (der Soundausgang am Raspi taugt nicht).
Raspberry für VNC einrichten, WLAN und Sound USB Stick.
MDP installieren: Internetradio (etliche gute hints) und hier. Kleine Hürden hier: Eirkennen der USB-Soundkarte und Lautstärkeeinstellung derselben, da muss man ein wenig nachlesen. Ausprobieren per von MDP über SSH oder VNC.
Shairport (Airport client) installieren: Gute Anleitung hier und hier. Ich hatte Probleme ein Perl-Modul nach zu rüsten. Die Lösung dazu findet man hier. (Problem: “Warning: Cannot install NET::SDP, don’t know what it is.”. Lösung:
sudo cpan
install NJH/Net-SDP-0.07.tar.gz
exit
Das Internetradio kann man perfekt mit der App MPoD fernsteuern. Airplay ist ja sowieso an Bord.
Raspberry Pi (Auch für Dummies)
Hat ein wenig gedauert bis ich welche hatte. Aber das Warten hat sich gelohnt (auch weil die Software inzwischen reifte 🙂 ).
Was ist es? Ein Minicomputer, etwas größer als eine Kreditkarte, mit 2 USB Anschlüssen, Audio out, Video out und HDMI (=DVI) Ausgang. Zusammen mit einer SD-Karte und einem Netzteil wird ein Linux Rechner daraus.
Vorab, für die Ungeduldigen, schon mal meine Bewertung: 8/10!
Wow, ich bin begeistert. Ein wirklich schönes Gadget. Kurz, was ich bisher ausgetestet bzw. gebaut habe:
- XMBC (Eine Art Apple TV für Linux, Videos, Musik abspielen, Internetradio, YouTube, ARD-Mediathek, usw.) (bisschen Einstellungen suchen nach Installation).
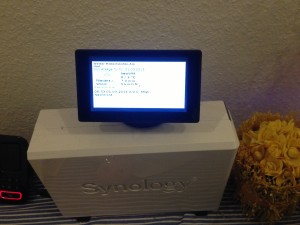
- Wetter Monitor in unserem Flur (läuft jetzt seit ca. 2 Wochen ohne Mucken. Hardware siehe unten) (bisschen Einstellung notwendig).
- MAME (Emulator für alte Spiele) (Hmm, die Hälfte der getesten ROMs liefen).
- MPD (MusicPlayerDaemon; Spielt mp3s und Internetradio ab) (bisschen Einstellung notwendig)
- Zur Ergänzung des Wettermonitors, sonst idelt der ja nur: LAMP installiert und darauf dann noch Joomla (ein CMS) (easy)
- Und weil es immer noch performt und Google den Reader abschalten will: Noch TinyTinyRSS (heise Anleitung) mit der mobile Erweiterung
Was sollte man haben (KnowHow und Hardware)?
Ein paar UNIX Basics wären schon nicht schlecht, oder man lernt sie dabei. Nein, man muss nicht Löten können. USB-Stecker richtig rum reinstecken reicht. Ich empfehle folgende Hardware:
- Den Paspberry Pi
- Ein paar (2 oder mehr) SD Karten (>=4 GB) (Jede Karte ein eigener Rechner 🙂 )
- Eine Stromversorgung (5V, 1A) bzw. einfacher..
- … gleich ein aktives USB-Hub mit mindestens 1A (möglichst kein Ramsch). Versorgt gleichzeitig den Raspberry.
- Ein HDMI auf DVI Adapter (damit man (am Anfang) auch mit dem Monitor testen kann. Oder ein HDMI Kabel wenn man (nur) an den fernseher will. Später reicht übrigens auch ssh, also rein remote.
- Tastatur und Maus. Später reicht ssh
- Ein USB WLAN Dongle (wenn man weg vom eingebauten Ethernetanschluss will)
- Wer möchte auch noch ein Gehäuse dazu.
Die links ergänze ich Euch noch zusätzlich. Und im nächsten Blog, Mini HowTos. Stay tuned.


